PROJECT FILE / 02
Malaria Intelligence
A DHIS2-style malaria surveillance dashboard for Zambia, connecting live WHO indicators with facility-level exploration, data-quality signals and outbreak-oriented alerting.
JavaScriptDHIS2WHO GHO APIChart.jsLeafletTailwind
 G/02
PRODUCT IN MOTION
See the system, not just the screenshot.
This original project footage is part of the build archive and shows the working interface.
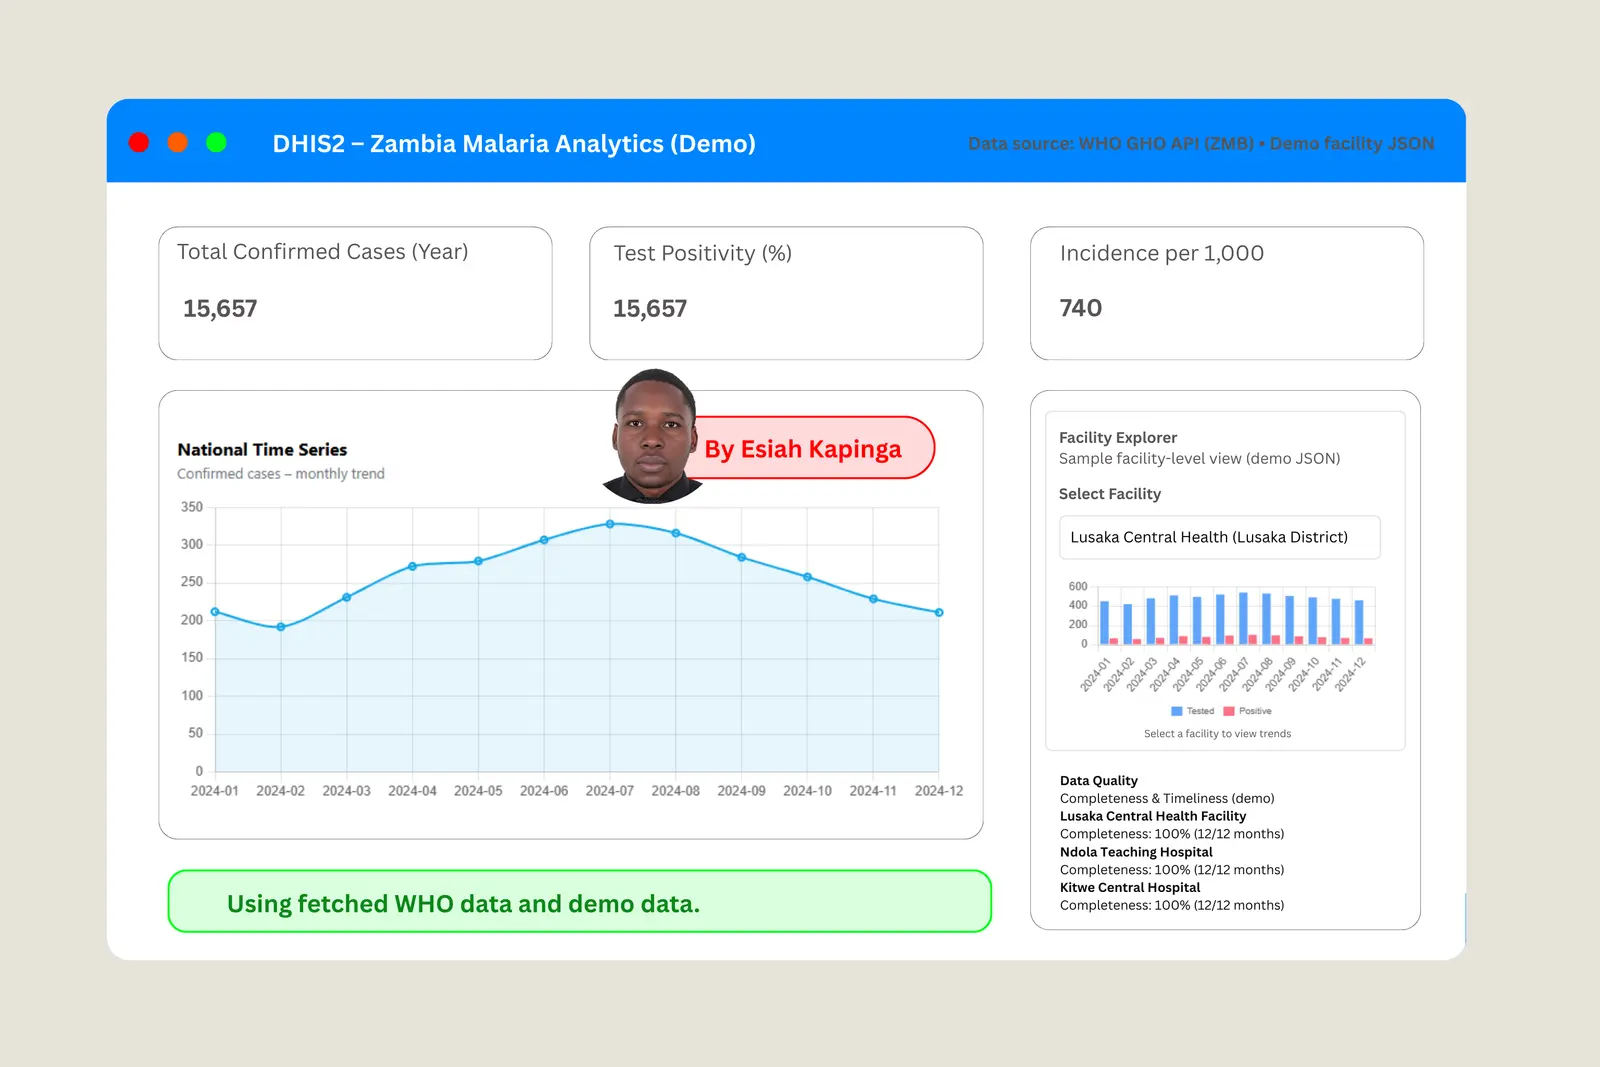
The dashboard brings live national indicators and simulated facility reporting together in one surveillance workspace built around action: KPIs, maps, facility monitoring, data-quality checks and alerting.
OVERVIEW
Overview
This project demonstrates malaria surveillance analytics for Zambia in an interface modelled on DHIS2, the health management information system (HMIS) used by ministries of health across Africa.
National indicators load live from the World Health Organization's Global Health Observatory (GHO) API. Because WHO does not publish facility data, facility-level views are simulated from a small local dataset that mimics DHIS2 facility reporting.
The aim is to show how routine health data can become actionable surveillance intelligence, so that a programme officer can move from a national trend to a single facility, check whether reporting is complete, and see when activity crosses an alert threshold.
Objectives
- Pull live national malaria indicators for Zambia from the WHO GHO API.
- Present national trends as a time series suitable for surveillance review.
- Give geographic context with a Zambia map of health facility locations.
- Let users explore facility-level trends and mini-profiles.
- Demonstrate data-quality monitoring and a simple early-warning rule.
Methods and tools
- National data
- WHO GHO API, MALARIA_COUNTRY resource filtered to SpatialDim = 'ZMB' (Zambia) and the selected year.
- Facility data
- A local synthetic JSON file simulating facility-level reporting, used where official facility data is not publicly available.
- Visualisation
- Chart.js for KPI trends, Leaflet with public GeoJSON for the map, Tailwind for a windowed DHIS2-style analytics workspace.
- Data quality
- A completeness and timeliness module showing how reporting gaps would be surfaced.
- Alert rule
- Alert when current test positivity is at or above the mean of the last 12 months plus two standard deviations, a common early-warning threshold in surveillance dashboards.
Key features
- Live national malaria KPIs: confirmed cases, test positivity and incidence per 1,000.
- National time-series chart for monthly trend analysis.
- Zambia map context with health facility locations.
- Facility Explorer with facility-level trends and profiles.
- Data-quality module covering completeness and timeliness.
- Client-side outbreak alert using the mean + 2 SD rule.
- Lightweight static build: HTML, Tailwind, Chart.js, Leaflet and vanilla JavaScript, with no backend.
Limitations and next steps
- WHO publishes no official facility-level data, so facility views use demonstration data.
- A true district-level choropleth depends on available district GeoJSON.
- Alerts and calculations run client-side and are simplified for demonstration.
- Next steps: replace the synthetic data with a real DHIS2 export, add district GeoJSON, and move indicator aggregation and alerting server-side for production.
Explore the original work
BUILD OUTPUT
What the project delivered.
Live national malaria KPIs from the WHO GHO API
Facility-level KPI and trend exploration
Data completeness and timeliness checks
Automated signals for unusual malaria activity
Project statusAvailable in archive
Open original build