PROJECT FILE / 01
SYLA Analytics
An AI-powered platform that turns raw CSV and Excel files into visualisations, plain-English forecasts and clear explanations, without a complicated analytics workflow.
ReactFastAPIGPT-4o-miniProphetPostgreSQLChart.js
 G/01
PRODUCT IN MOTION
See the system, not just the screenshot.
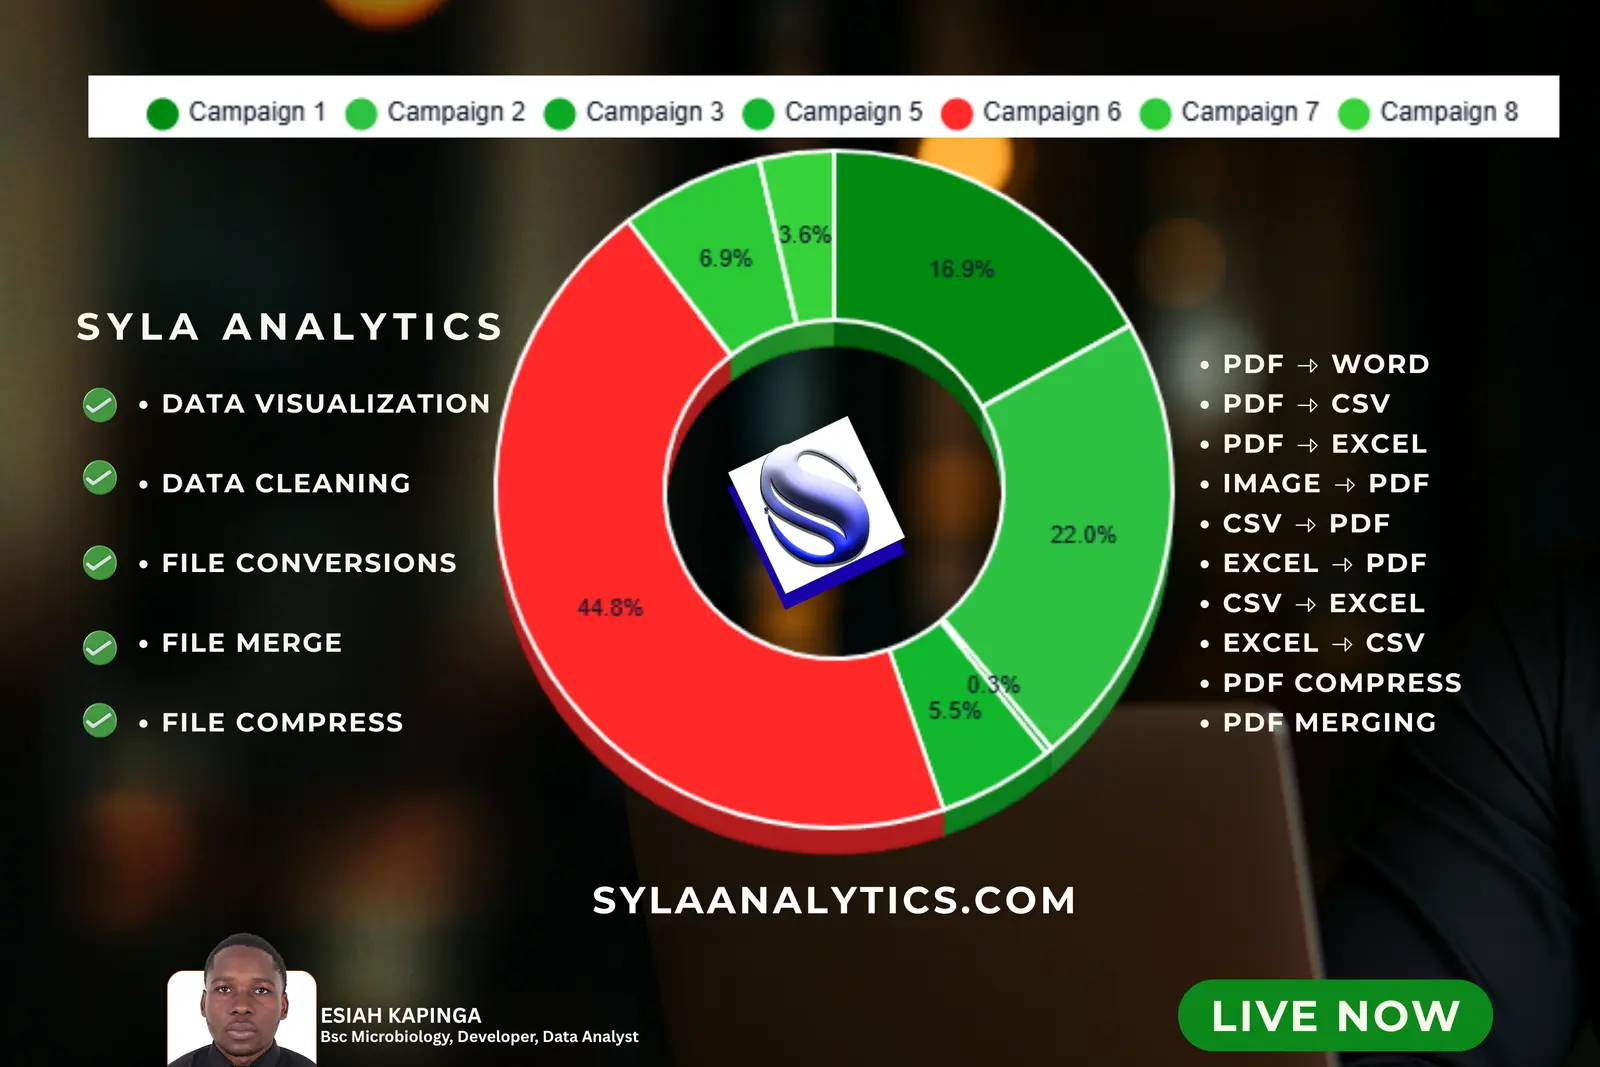
This original project footage is part of the build archive and shows the working interface.
SYLA combined automated chart generation, natural-language forecasting and file conversion into one accessible product experience.
OVERVIEW
Overview
SYLA Analytics is an AI-powered data platform that automates chart generation, provides natural-language forecasting and offers file conversion tools. It was built with React, FastAPI and OpenAI models to remove the manual work of turning a spreadsheet into charts and a report.
The first version was built and demonstrated end to end. SYLA is now being rebuilt as GOLIDE's first SaaS product, and this page documents the original build.
The problem
- Popular analysis tools require manual chart creation for every dataset.
- Reports cannot be generated automatically from raw data.
- Forecasting requires specialised statistical knowledge.
- Enterprise analytics tools are expensive and slow to set up.
- File-format conversion is a repetitive, time-consuming chore.
Methods and tools
- Frontend
- React 18, Chart.js, TailwindCSS and Vite.
- Backend
- Python 3.11+, FastAPI, Pandas and Prophet.
- AI models
- OpenAI GPT-4o-mini for natural-language scenarios, combined with Prophet time-series models.
- Database
- PostgreSQL with SQLAlchemy ORM.
- Authentication
- JWT tokens and Google OAuth 2.0.
- Deployment
- AWS: EC2, IAM, VPC and Aurora/RDS.
How it works
- Upload: drag and drop a CSV or Excel file of up to 10 MB.
- Auto-process: SYLA cleans the data, detects column types and generates summary statistics.
- Visualise: bar, line, pie, scatter and area charts are generated automatically, with customisable options.
- Forecast: describe a scenario in plain English, such as '15% marketing increase next quarter', and get a forecast with 95% confidence intervals from a hybrid GPT + Prophet model.
- Convert: move between PDF, Excel, CSV and Word, merge up to 15 PDFs, and compress files at three levels.
- Export: download charts as PNG, SVG or PDF, or integrate through a REST API with OpenAPI documentation.
Applications
- Business analytics: sales forecasting, revenue trends and customer analysis.
- Healthcare: patient data visualisation, epidemic modelling and resource planning.
- Finance: portfolio analysis and risk assessment.
- E-commerce: demand forecasting, inventory planning and conversion tracking.
- Education: student performance tracking and enrolment predictions.
Results and rebuild
- Reported for the original build: chart creation time cut from about 5 minutes to about 15 seconds.
- Reported for the original build: 85-95% forecast accuracy for short-term predictions (1-12 periods ahead).
- Files of up to 10 MB with 100,000+ rows handled efficiently.
- The rebuild focuses the product on visualisation, forecasting and file intelligence in one workspace.
Explore the original work
BUILD OUTPUT
What the project delivered.
Automated chart generation from uploaded data
Natural-language forecasting workflows
Multiple document and tabular file conversions
A full-stack product architecture ready for its next rebuild
Project statusAvailable in archive
Open original build